SSEP research identified six resource-clusters for creating a vibrant, stable and sustainable future for the next generation. We call these our Regional Economic Pillars.
Carefully organized around our excellent location, freight advantages, abundant natural resources, geography, skilled workforce and rich regional history, these pillars form the foundation of our Economic Development Plan.
Our strategic plan aligns with our core values, vision and mission, and provides a balanced approach to our long-term social, environmental and economic sustainability. This section explores each pillar in more detail and compares their potential.
The Pillars
- Destination Tourism
- Logistics and Distribution Hub & Municipal Infrastructure
- Water for Economic Development
- ValueAdded Agriculture Processing & Resource Innovation
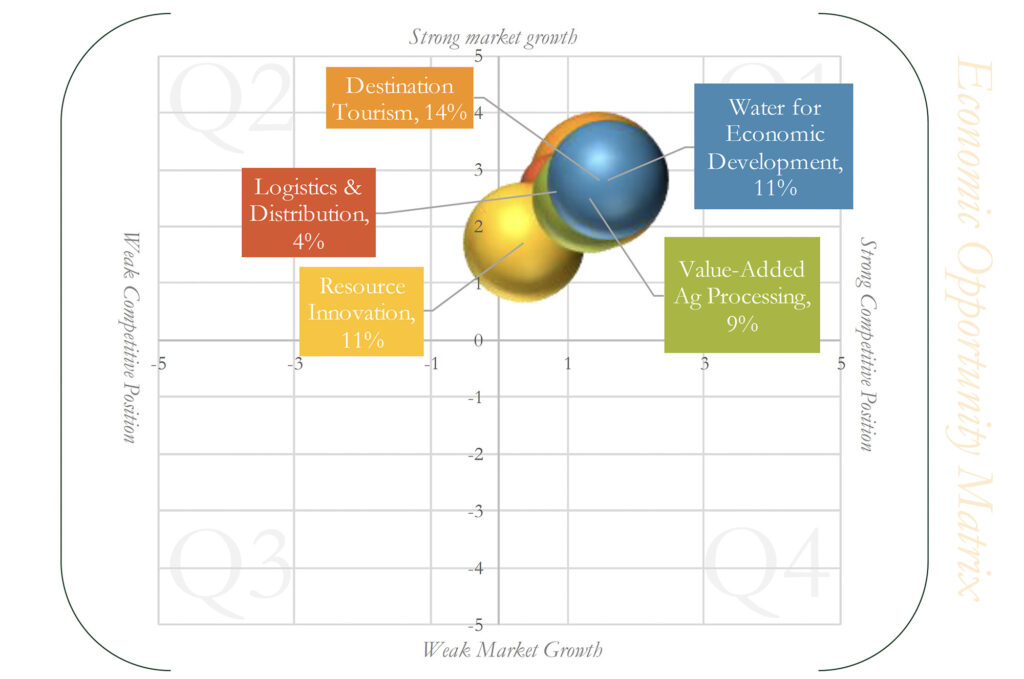
The SSEP Regional Economic Pillars were plotted on an Economic Opportunity Matrix to demonstrate where opportunities lie relative to market strength and overall competitive position.This provides data-driven strategies for how to strategically approach each pillar in the region and ways to best develop individual opportunities.
NOTE: we excluded Municipal Infrastructure from this analysis as it is foundational for all other projects.
- Q1: strong market, strong competitive position
- Consider deeper market and product strategies to remain competitive and solidify market share
- Q2: strong market, weak competitive position
- Consider intensive market & product development to get competitive or consider un-related product line
- Q3: slow market, weak competitive position
- Not a good business place; should re-evaluate business
- Q4: slow market, strong competitive position
- A slow market means low revenues; consider un-related product diversification or pursue joint ventures
Each quadrant represents a particular combination of market and competitive position with related development strategies. For example, Q1 represents a strong market and strong competitive position, and Q4 suggests weak market and weak competitive position. Q1 strategies solidify and enhance an already competitive position and aim to capture more market share or niche markets. Alternatively, Q4 strategies focus on developing alternative or new markets and products.
Correspondingly, the size of each bubble represents an index of potential investment profitability, measured as Compound Annual Growth Rate (CAGR). CAGR is expressed as a percentage and broadly predicts what investors could have at the end of an investment period (typically, 3 years). This index is more accurate at the level of individual opportunities; however, as we have done here, multiple CAGR can be averaged out to provide a high-level comparison between ‘big ideas.’
What does this mean for SSEP?
It is excellent –but unsurprising –news that all the Pillars are in Quadrant 1 as this analysis was conducted in the mid-planning stage and excludes some ideas brought to the table during the initial brainstorming sessions. This means that opportunities that may have fallen into weaker positions have already been filtered out of the process. Also, these pillars are plotted based on the average scores for the individual opportunities within each pillar, meaning that this is a very high-level look and comparison. The detailed data is available as an appendix.
What does this Matrix tell us?
The five opportunities are clustered in a strong market growth position, meaning that each is generally considered to have accessible and reliable markets, and/or potentially have little competition. However, the Water for Economic Development and Destination Tourism potentially have slightly stronger and similar market growth potential due to less regional competition and a very strong market for agricultural irrigation. In part, the Resource Innovation Pillar is slightly lower on the market growth scale due to higher levels of competition for renewable energy projects and more regulatory barriers that reduce the ease of market access and business development.
In terms of competitive position, the five opportunities are clustered around a low-medium level of competitiveness. In large part, this is because SSEP is in the early stages of economic planning and investment attraction. However, this matrix demonstrates that, even without strategic planning, SSEP is already in a positive competitive position.
At the time of this analysis, Tourism and Water for Economic Development are slightly stronger in part because the individual projects have a high potential to create spin-off opportunities or can easily scale from small to medium sized businesses.
In contrast, Resource Innovation is near middle of the matrix, meaning that there are still a number of uncertainties around the development of Rare Earth Element mining or hydrogen-based projects. Further, some of these opportunities, such as the Resource Innovation Centre and Activated Carbon manufacturing offer fewer opportunities for spin-off businesses when compared to Solar or Geothermal Projects.
All in all, this matrix confirms that SSEP’s early-stage planning and analyses are on track with our vision and mission. The pieces, energy and vision are in place and SSEP is ready to make the future potential of Next-Gen Rural a vibrant reality here and now.
The Southeast Sask Economic Partnership is working with the RMs of Estevan and Coalfields and the Town of Bienfait to bring new ecomonic opportunties to our region.